

↗01
Acquisition
Purchase, installation and replacement-cycle costs.
 Total Cost of Ownership
Industrial lifecycle cost decisions
Compare repair and replacement options across maintenance, downtime, production and energy-before the next work order becomes another expensive assumption.
01 / The problem
An asset does not stop costing when the invoice is paid. Every service, breakdown, production interruption and wasted kilowatt changes which option is actually cheaper.
02 / One complete view
Built around real operating inputs-not a hidden score or unsupported prediction.
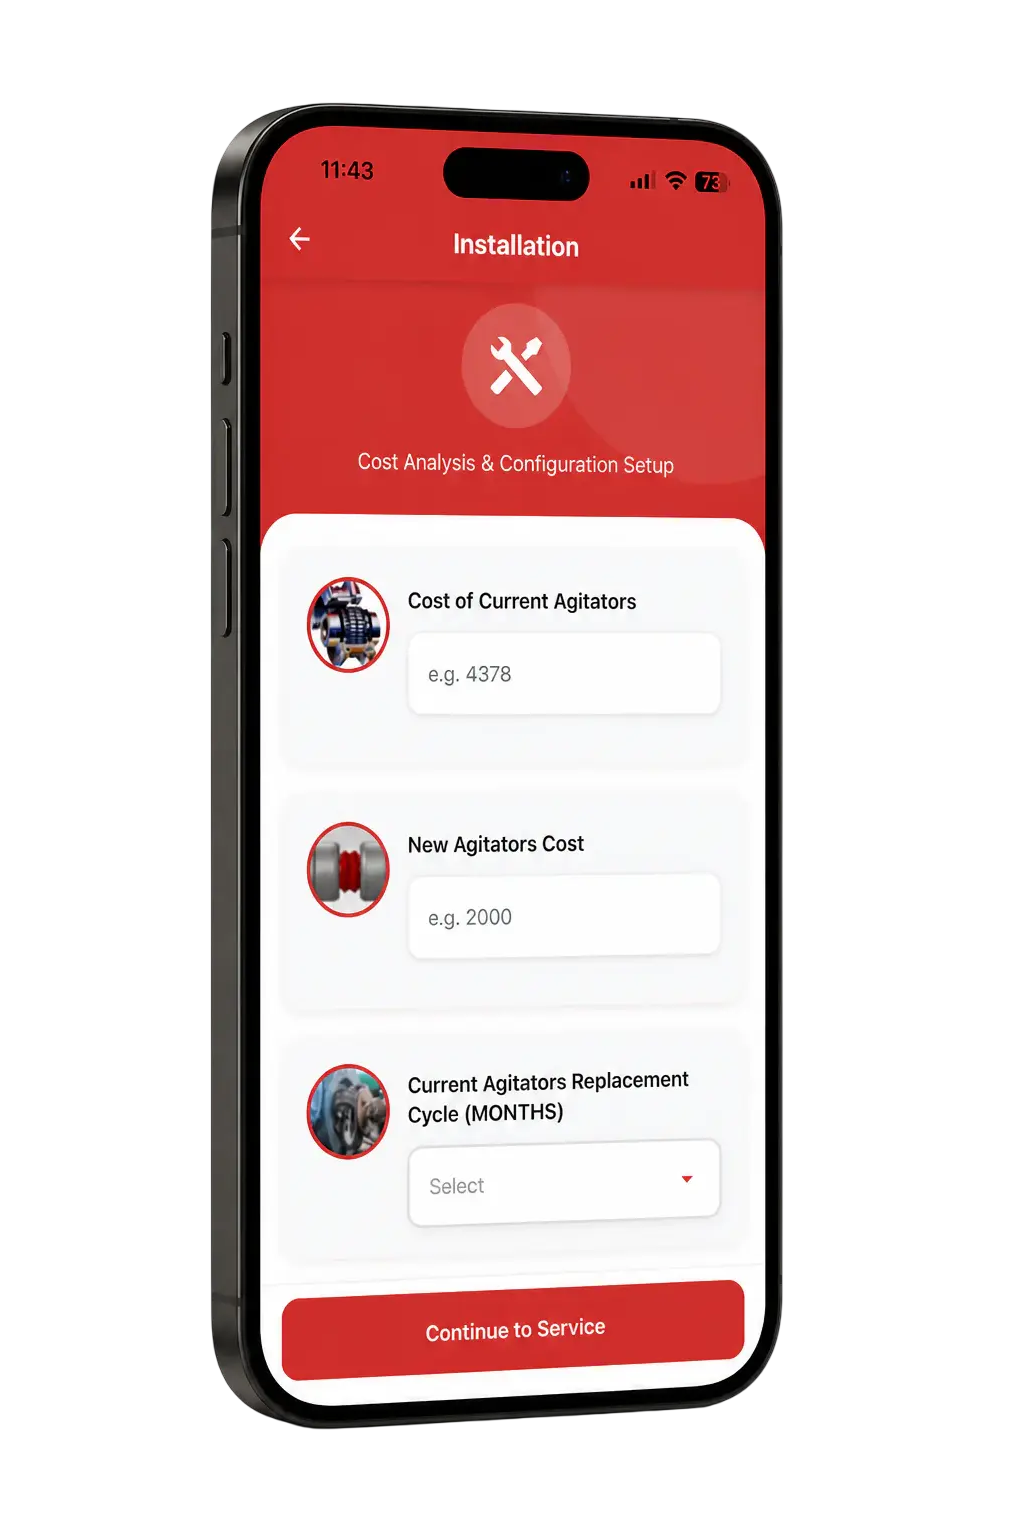
Purchase, installation and replacement-cycle costs.
Service intervals, work hours and labour rates.
Recurring parts and unscheduled repair costs.
Breakdown duration and lost production impact.
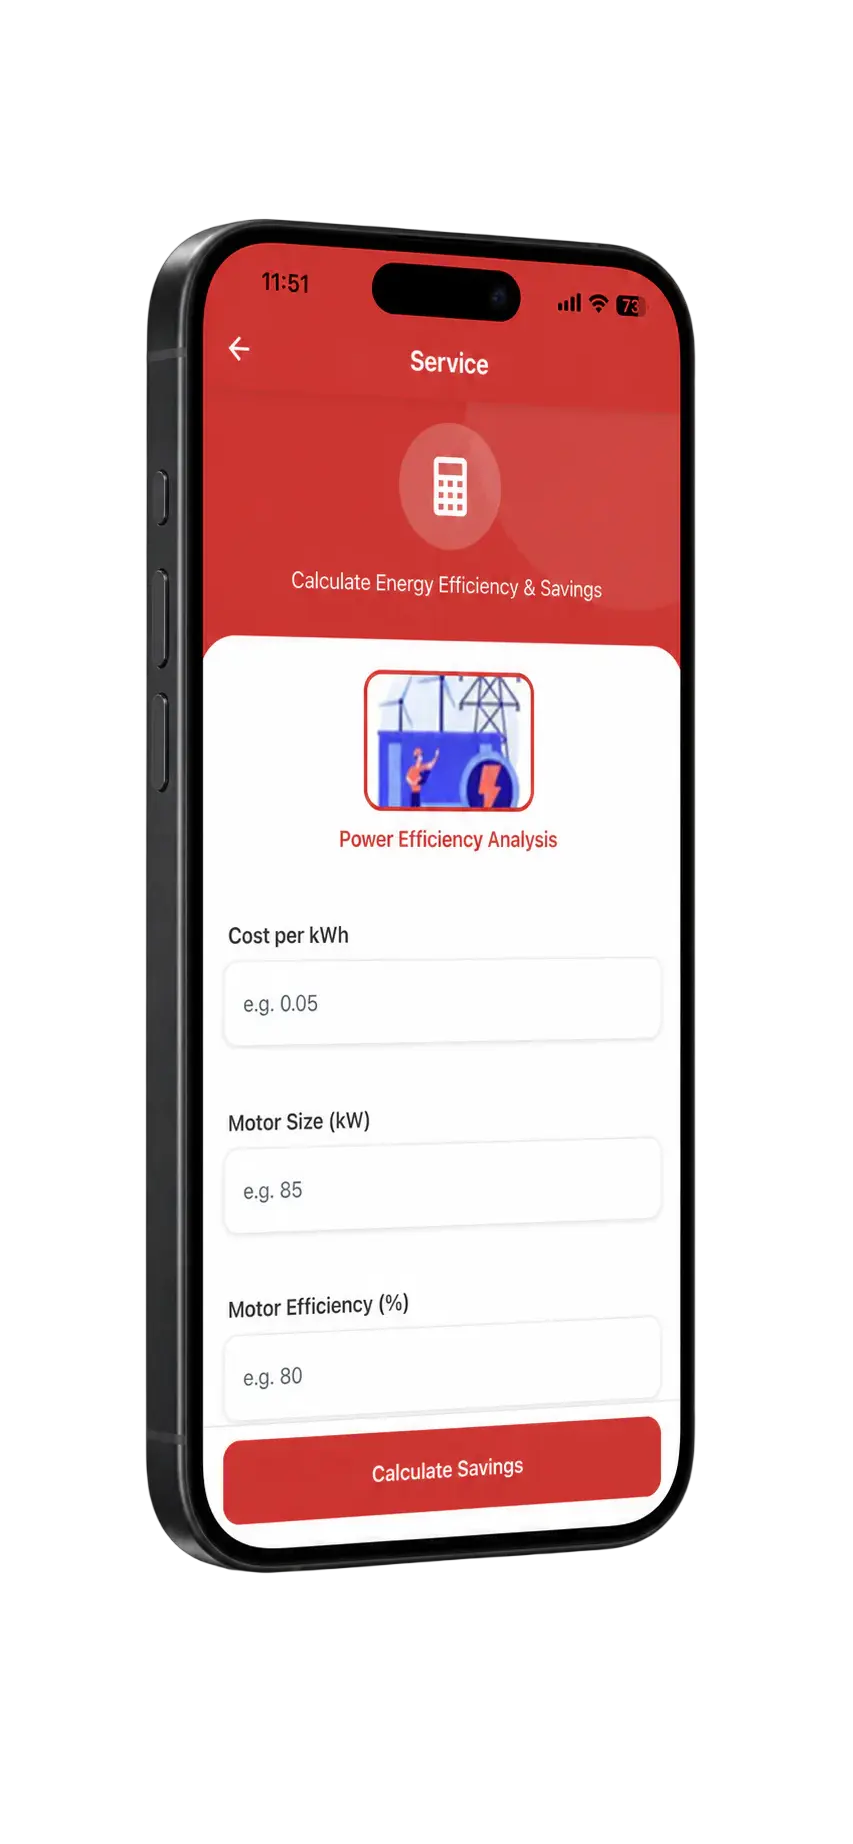
Motor load, efficiency, operating hours and tariff.
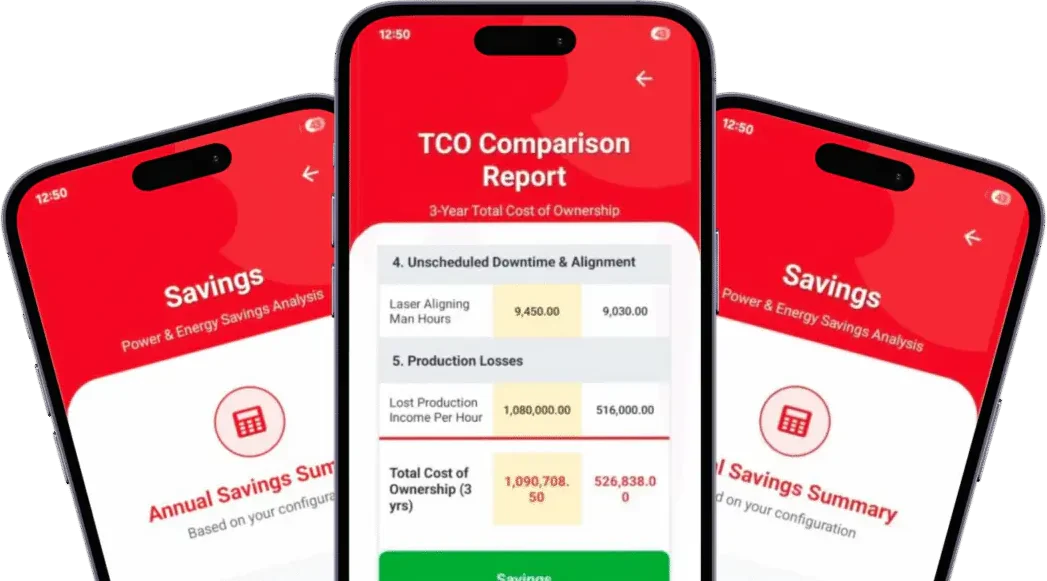
A reviewable side-by-side lifecycle cost breakdown.
Try it with your numbers
Build a quick indicative comparison. Your inputs stay in this browser and are not sent to our server.
03 / Product workflow
One guided sequence keeps the assumptions organised and the comparison reviewable.
Enter the current and alternative acquisition costs, replacement cycles, service requirements and labour reality.
Use the numbers your maintenance and operations teams already know.
Add service, downtime, production and energy assumptions on one horizon.
Compare category totals and carry a clear recommendation into approval.
04 / Energy impact
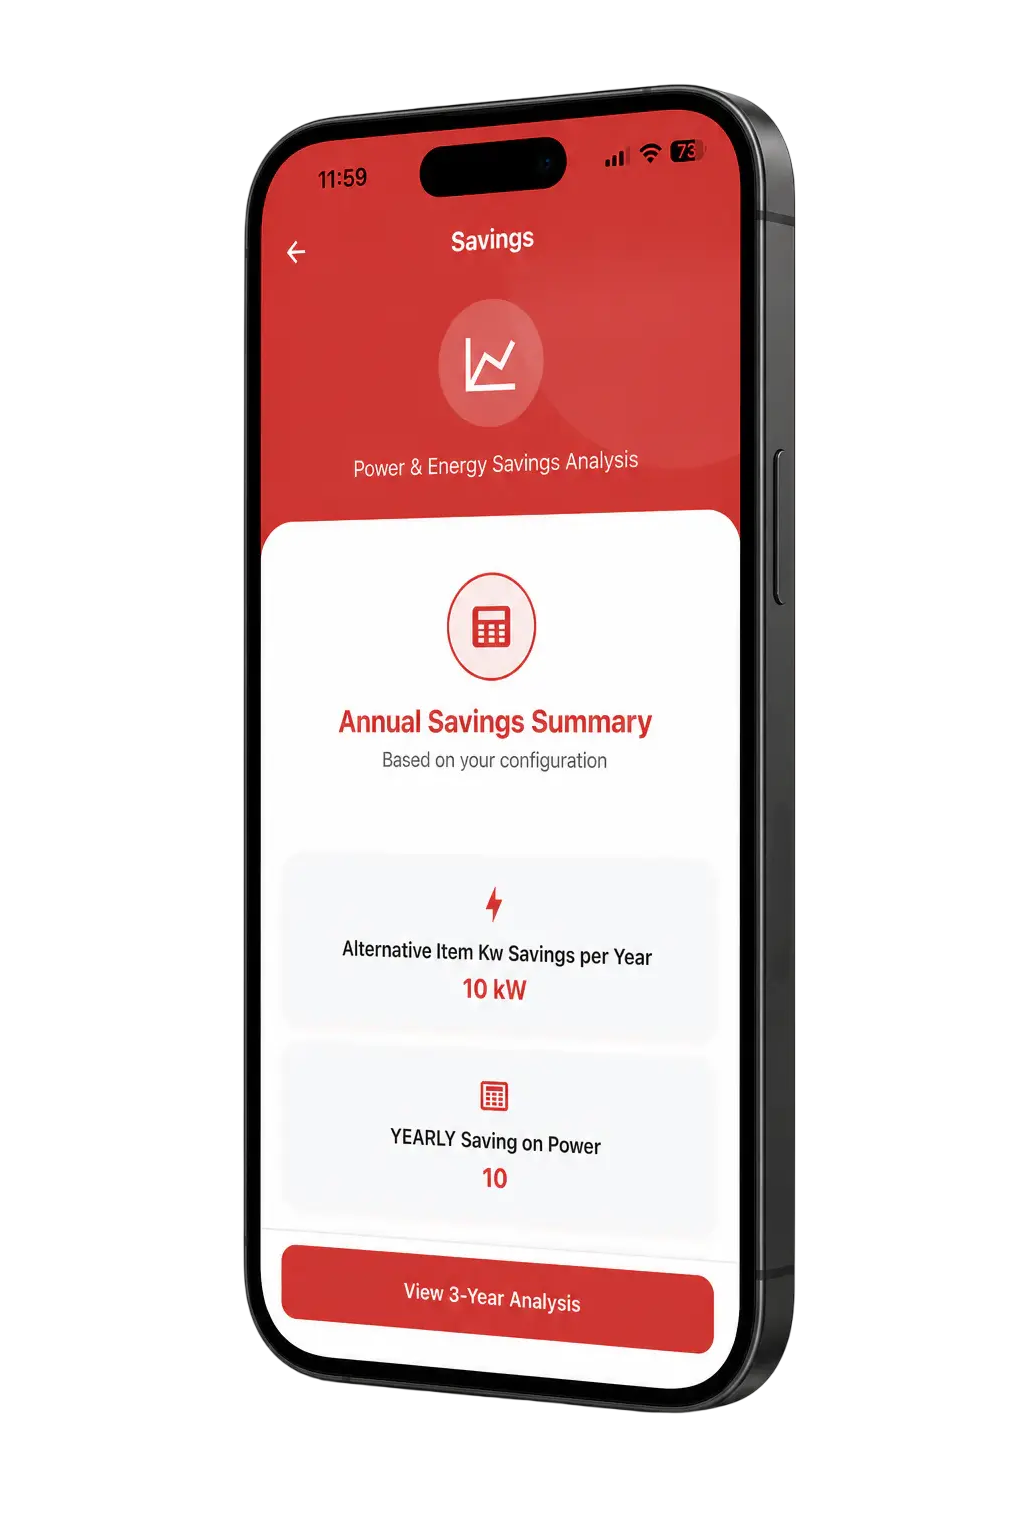
Model electricity price, motor size, efficiency and operating schedule to reveal the power cost hiding inside the equipment decision.
Built for consequential equipment
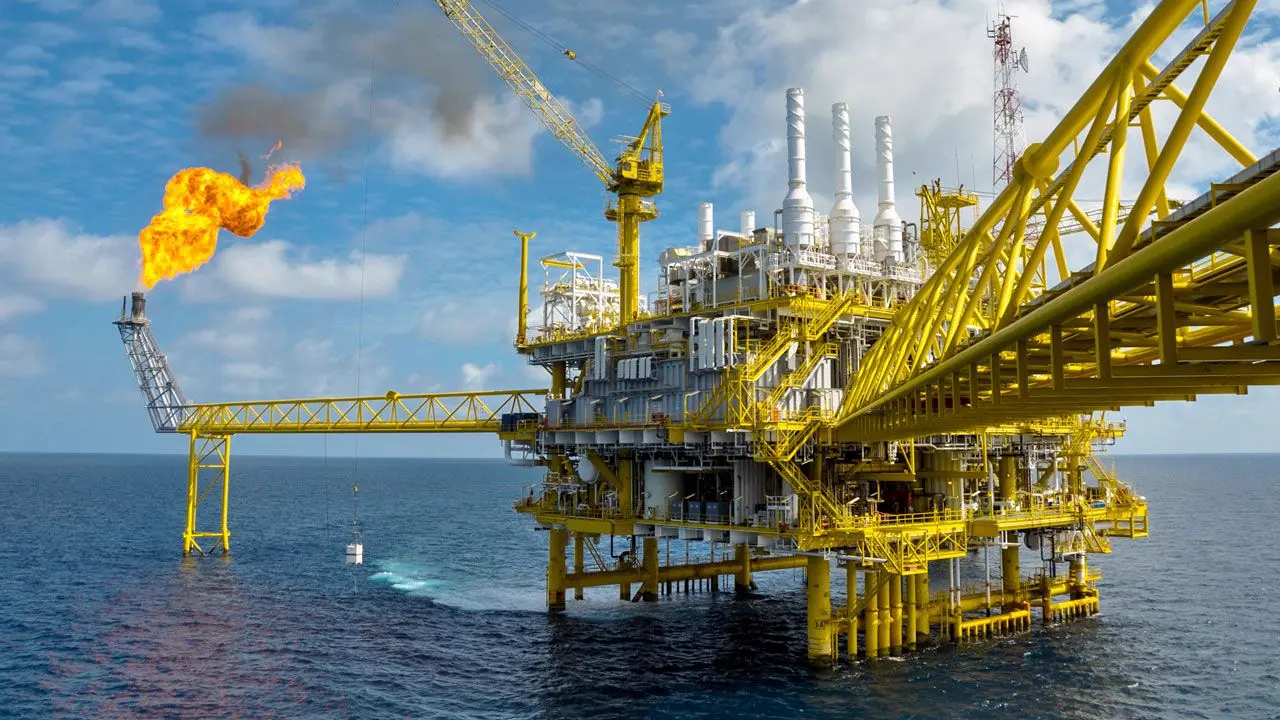
Total Cost of Ownership is most useful where downtime, service effort and energy materially change the economics of repair or replacement.
05 / Shared decision language
Each stakeholder sees the part of the decision they are responsible for-without losing the whole picture.
Move from another repair request to a lifecycle-backed recommendation.
Translate failure patterns and equipment life into financial consequence.
Compare supplier options beyond the number on the quotation.
Put a value on downtime, disruption and production risk.
Review the assumptions behind a capital request-not just the total.
Make one decision with technical and commercial teams aligned.
Need a path tailored to your role or asset class?
Explore use cases ↗06 / The output
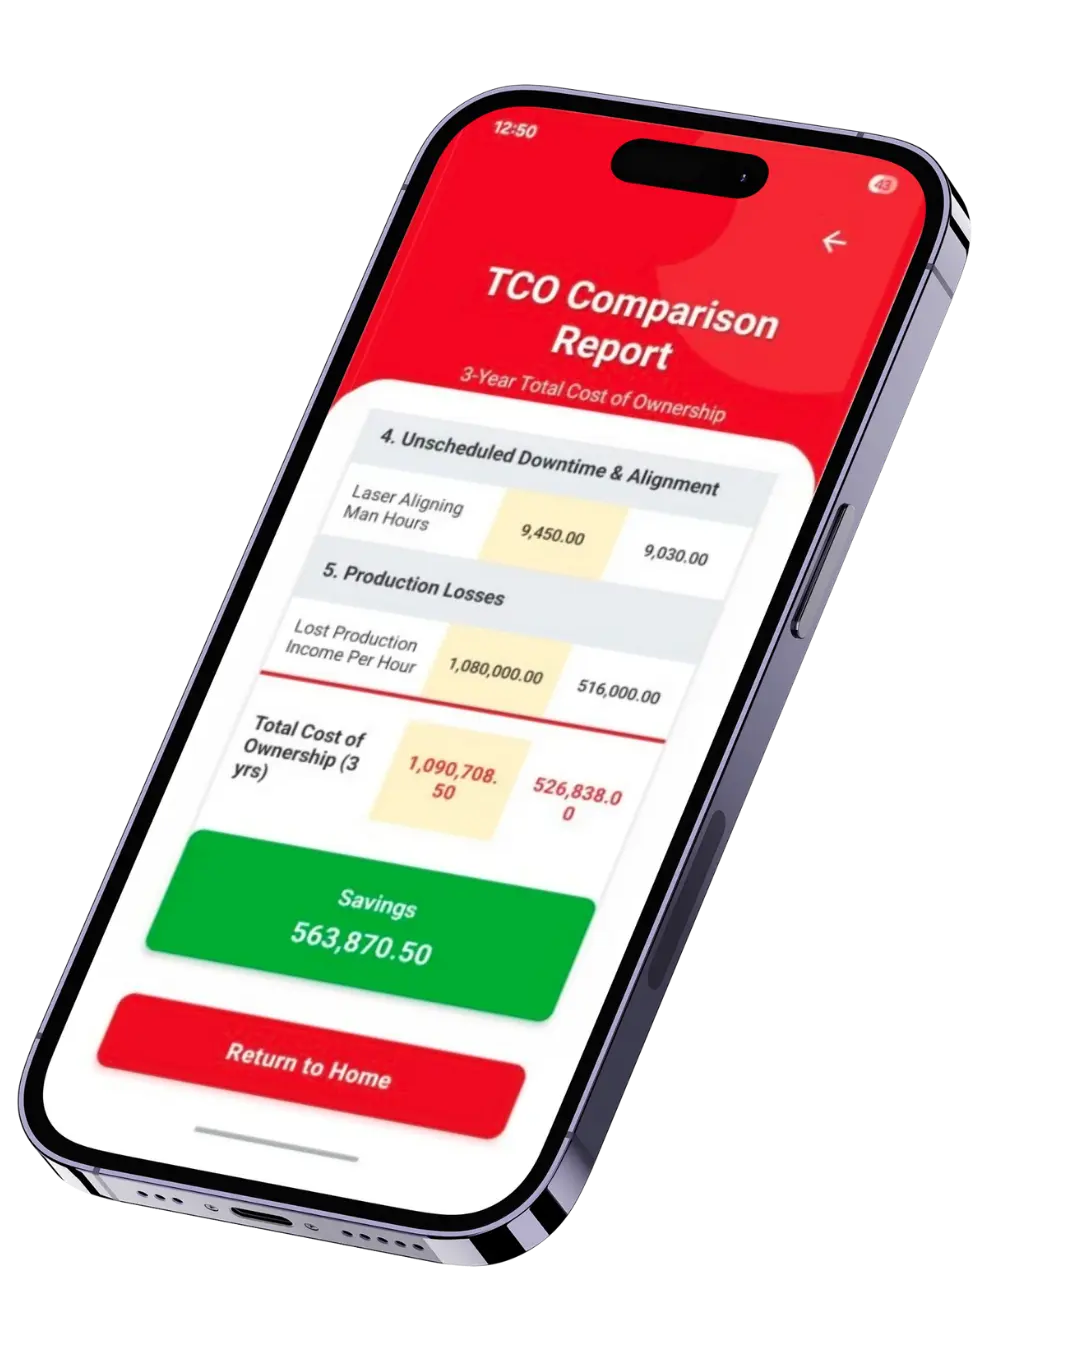
The report organises acquisition, labour, repairs, downtime, production and power so reviewers can see exactly where the result comes from.
07 / Start with value
Test one repair-versus-replace decision directly on this page.
Continue into detailed service, power and reporting workflows.
08 / Questions
What to know before you model your first decision.
It compares equipment options across acquisition, planned labour, parts, unscheduled downtime, production loss and energy over a shared time horizon.
Your next equipment decision
Run an indicative calculation now, or take the complete workflow into your workspace.